
A scientist and an artist on stage.

Dr. Kirell Benzi · keynote speaker · data artist · AI researcher at EPFL · Lausanne and Paris

I give talks on AI, data and technology for good. The artist in me is hopeful about what technology can do for people. The scientist in me sticks to the facts and leaves the hype out. I write each talk for the event, and when it fits, the audience answers live from their phones.

75
public appearances
17
countries
2017
on stage since

On stage since 2017.

I have spoken at TEDx and on a tour of US universities. I have also given courses at university level in several schools, and workshops for companies. Wherever I speak, I bring work from my studio to show.

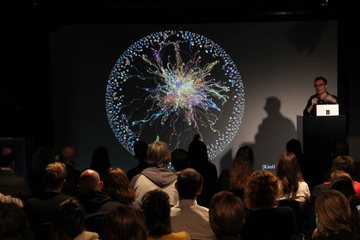
Kirell Benzi speaking at a lectern in front of a large projected network artwork, seen over the heads of the audience

Move your mouse over the photo

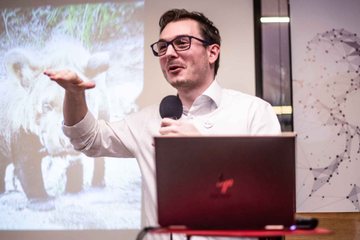
Kirell Benzi speaking into a microphone, gesturing towards a projected photograph
Portrait of Kirell Benzi

Dr. Kirell BenziI’m a scientist and a data artist. I work as an AI researcher at EPFL, where I also did my PhD on network science and data visualization. In my studio, I look for the balance between soul and numbers. I speak French and English.

  • TEDx, 2018
  • Data Art Tour of US universities, 2020: Stanford, Princeton, Cornell, UCLA
  • Outlier, Porto, 2023

Why organisers book me.

Hopeful and grounded

As a data artist, I look for what technology can do that is useful and beautiful. As a scientist, I check it. I work on AI at EPFL and build AI systems in my studio, so I can tell your audience what works today and what is still hype.

The audience takes part

With Acclamor, people answer from their phones during the talk. You see what your audience thinks, and so do they.

Real work on the screen

I show projects from my studio, like the Montreux Jazz archive, a supercomputer’s activity in Stuttgart, or Cube: Fashion Takes Shape, which won two People’s Lovies. An idea is easier to grasp when you can see it working.

Ready on the day

I send a technical sheet in advance and rehearse on site. If the network fails, a recorded version of the live parts takes over.

Before and after the talk.

I write each talk for its event, around the people who will be in the room. It usually goes like this.

  1. A call

    We talk about the event, who will be in the room and what they should leave with.

  2. A proposal

    I send a title, an outline and the moments where the audience answers live. You can change everything at this stage.

  3. The build

    I make the slides, the demonstrations and the live questions, with examples from your sector.

  4. Afterwards

    You keep the slides and the room’s anonymous answers, which show what your people think. If your team wants to go further, I can run a workshop.

Topics I’m often asked about

  • What AI agents change for a business
  • AI used for good
  • Data, art and creativity
  • How generative AI works, shown live
  • Archives, heritage and AI
  • The security risks of AI agents

Two talks I already give.

I adapt them to each audience, or we use one as the starting point for yours.

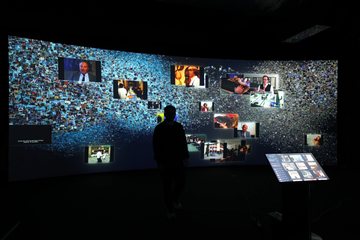
A visitor in front of a curved wall of archive footage arranged by AI, with a touch screen to explore it
REMIT, AI archive research with eM+ EPFL and RTS, 2026

Business leaders · 35 to 45 min · 2026

AI Never Sleeps: New Opportunities, New Risks

A talk for business leaders about AI agents: what they can already do for a company and the security risks that come with them. I show it with a live demo of agents at work in a supplier’s operations.

  • The difference between a chatbot and an agent
  • Everyday uses for a company, from research to follow-up
  • How to protect confidential information and approve what agents do
  • How to choose and test a first use case

Live demo · audience votes · French or English

Jazz Luminaries: a network of 5,400 jazz artists projected on a dome above a visitor
Jazz Luminaries · Montreux Jazz Festival · 2019

Any audience · 30 to 60 min · giving talks since 2017

Everything Is Data

My data art talk. I show how I turn data into images and installations that people feel first and understand second, with work like the Montreux Jazz archive under a dome or a supercomputer’s daily activity in Stuttgart.

  • What separates data art from data visualization
  • Examples from music, sport, science and food
  • Why emotion is a good way into data

Data art · French or English

The work I show on stage.

These projects come with me in the talks. I made them for brands, festivals, museums and research centres.

HPC Data SymphoniesHLRS · 2026
The Galaxy of TasteAlimentarium · 2026
Jazz LuminariesMontreux Jazz Festival · 2019
REMITeM+ EPFL and RTS · 2026
The Art of TouchNike · 2023
Cube: Fashion Takes ShapeGoogle · 2022
Access GrantedSTid · 2025
Circadian RhythmsPolar · 2022

Acclamor · built in my studio

The room takes part in the talk.

People join from their phones with one QR code, with no app to install. We choose the moments that fit your event when I write the talk.

A question opens on every phone. I react to the answers as they arrive.

Pick the colour of the room

Formats and practical details.

In French or English. I adapt the length to your programme.

  • Keynote20 to 60 minA talk written for your event, with live demonstrations.
  • Interactive keynote30 to 60 minThe same, with questions the audience answers on their phones.
  • Masterclass or workshophalf dayA hands-on session after the talk, for a leadership or innovation team.
  • Panel or fireside conversationon requestI’m happy to join a panel or a conversation on stage.
based in
Lausanne and Paris. I travel to the event.
languages
French or English, questions in both
stage
One projector or LED screen, sound for video
network
Venue Wi-Fi or mobile data. If the network fails, a recorded version of the live parts takes over.
privacy
People take part anonymously, and only totals are shown
booking
Fee and travel quoted separately

Everywhere I’ve been since 2017.

Talks, workshops, exhibitions and interviews. Keep scrolling and each one flies back to the city where it happened.

  1. Audemars PiguetLausanne · 2026
  2. Cultural Data Sculpting LectureLausanne · 2025
  3. Initiative for Media Innovation EventLausanne · 2024
  4. Women Techmakers @ Google AIParis · 2024
  5. Connecting the OPs - From online mastery to offline innovationCologne · 2024
  6. Convention annuelle ADIRALyon · 2023
  7. Cyber Physical: Architecture in Real TimeLausanne · 2023
  8. Outlier 2023Porto · 2023
  9. Lighten Up! symposium: Encounters between Art and ChronobiologyLausanne · 2023
  10. KPC data dayParis · 2022
  11. Polar Ignite 3 | Find Your Rhythm - Virtual Live EventUtrecht · 2022
  12. Neo4j Live: Graph Data ArtOnline · 2022
  13. SESI Lab ExhibitionBrasília · 2022
  14. Google Cube: Fashion Takes ShapeMilan · 2022
  15. TechArt ConferenceSeoul · 2022
  16. KnowledgeCon MasterclassLondon · 2021
  17. Lombard Odier annual conferenceGeneva · 2021
  18. Toronto MLToronto · 2021
  19. Data Blossom ExhibitionAubonne · 2021
  20. Des Points, Des Lignes Et Des HommesNantes · 2021
  21. Global AI SummitRiyadh · 2021
  22. Ely Center for Contemporary ArtNew Haven · 2021
  23. Strate Design SchoolSèvres · 2021
  24. DataFest 2020Tbilisi · 2020
  25. NeurIPS Creativity WorkshopOnline · 2020
  26. Covimetry ExhibitionPoland · 2020
  27. IIT 2020USA · 2020
  28. La PosteParis · 2020
  29. Knowledge ConneXionsLondon · 2020
  30. Convergence Initiative workshopCanada · 2020
  31. Data Natives Unlimited 2020Germany · 2020
  32. EU Publication Office Webinar SeriesLuxembourg · 2020
  33. Convergence InitiativeMontreal · 2020
  34. EP7 ExhibitionParis · 2020
  35. Fireside Chat: Data Art & Creative CodingOnline · 2020
  36. ALife conference 2020Montreal · 2020
  37. WWWerkschau - Lucerne University Of Applied Sciences And ArtsLucerne · 2020
  38. AI Governance ForumLausanne · 2020
  39. Data Art Tour: Cornell UniversityNew York · 2020
  40. Data Art Tour: Princeton UniversityPrinceton · 2020
  41. Data Art Tour: University Of California San DiegoSan Diego · 2020
  42. Data Art Tour: University Of California Los AngelesLos Angeles · 2020
  43. Data Art Tour: University of California IrvineIrvine · 2020
  44. Data Art Tour: Stanford UniversityStanford · 2020
  45. Data Art Tour: Specifica LabsLos Alamos · 2020
  46. Data Art Tour: Santa Fe InstituteSanta Fe · 2020
  47. Data Art Tour: Los AlamosLos Alamos · 2020
  48. Data Art Tour: Sorbonne UniversityParis · 2020
  49. National Swiss Radio PanelLausanne · 2019
  50. Data NativesBerlin · 2019
  51. DevFest NantesNantes · 2019
  52. Aloha College STEAM-B ConferenceMálaga · 2019
  53. Digit'all ART eventParis · 2019
  54. AW De La ComParis · 2019
  55. AI Night - House of Electronic Arts in BaselBasel · 2019
  56. Pint Of ScienceLausanne · 2019
  57. Visualizing KnowledgeEspoo · 2019
  58. Data Visualization & DesignHelsinki · 2019
  59. ekino DayLevallois-Perret · 2019
  60. Micro Macro MesoLyon · 2018
  61. Exhibition CallipygeCordes-sur-Ciel · 2018
  62. Podcast DataTalkOnline · 2018
  63. Data Lovers ExhibitionPorto Alegre · 2018
  64. TEDxAnnecy · 2018
  65. TransformTECHLausanne · 2018
  66. MAD session @ Palais des CongresParis · 2017
  67. EPFL Alumni GalaLausanne · 2017
  68. Invitation Keynote EPFLLausanne · 2017
  69. World Conference Of Science JournalistsSan Francisco · 2017
  70. Magistrale EPFLLausanne · 2017
  71. Interview national radio RTSSwitzerland · 2017
  72. Swiss Data DayLausanne · 2017
  73. Montreux Jazz WorkshopMontreux · 2017
  74. Ferme Des TilleulsRenens · 2017
  75. eCOMGeneva · 2017

75 appearances · 46 places · 4 online

Tell me about your event.

I’ll reply with my availability, a first idea for the talk and a quote. It helps to know:

  • The date, city and venue
  • Who the audience is, how many people, and which language
  • The talk or format you have in mind
  • Anything the talk should connect to, like the event’s theme or what your team is working on